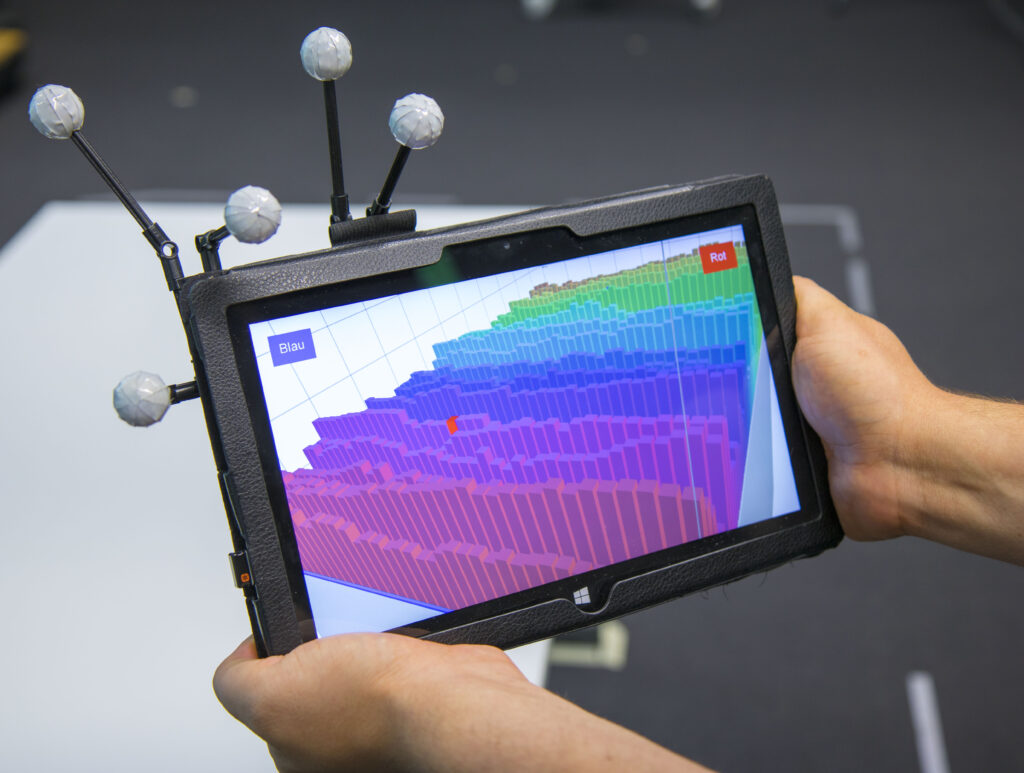
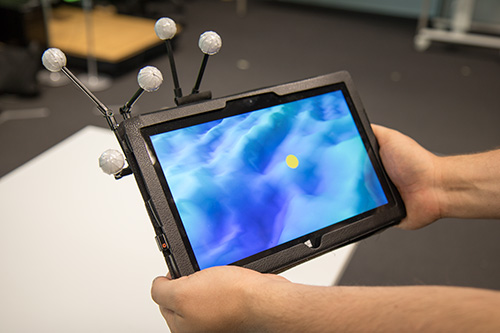
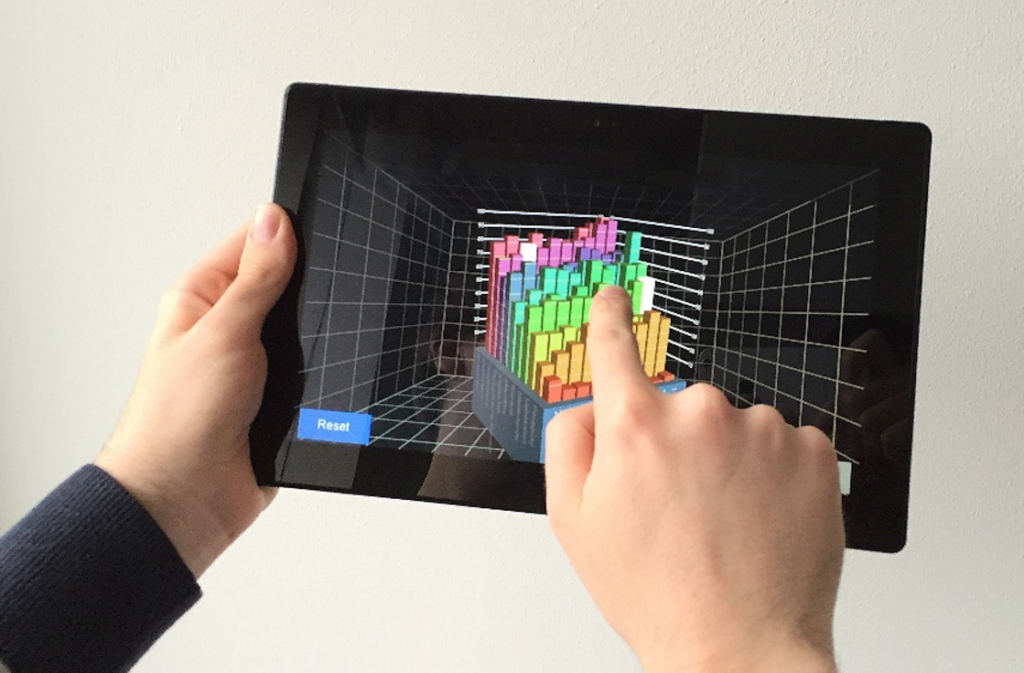
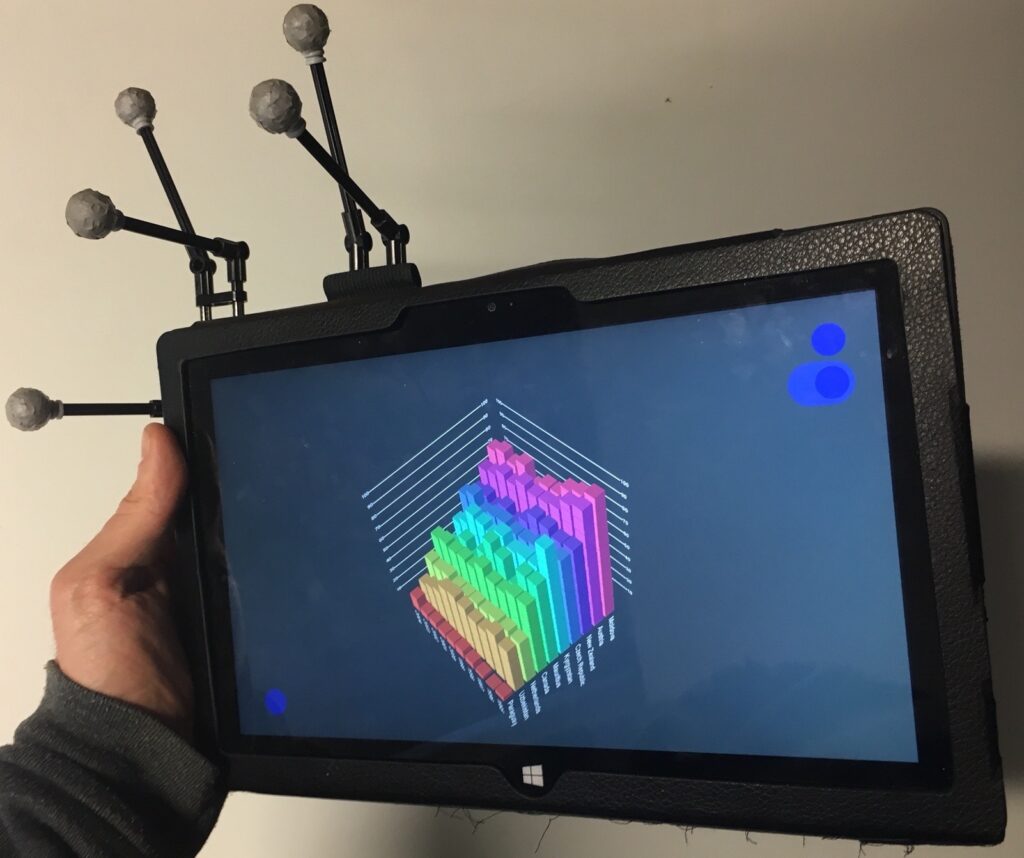
This project uses a tracked Tablet and spatial navigation to explore 3D Information Visualizations by physically moving a tablet. Furthermore, the users head was also tracked, enabling Head-Coupled Perspective. We explored how well this interaction style performs in comparison to a touch based interface in a qualitative user study. This project was developed at the Interactive Media Lab Dresden and resulted in three publications: A workshop paper and poster at the ACM ISS 2016 and a full paper at the ACM ISS 2017.

General
The Prototype was developed mostly solo by me, with the latter addition of another developer.
We used MonoGame as a 3D framework because of the high degree of freedom on designing the application, as well as the licensing situation. Therefore everything was written in C#. The implementation of Head-coupled Perspective is based on this this paper. OptiTrack was used as a tracking system for both the tablet and the user. A custom network component streams the data from the PC connected with the tracking system to the tablet using UDP and binary serialization.
We initially used SVN for version control, but later moved to git.
Details and Contribution
We used MonoGame as framework, which is more or less a convenient wrapper around DirectX and does not provide much in terms of program structure. Therefore as a first step I implemented a basic scene graph and entity structure, which allows for nested objects and simplifies development. Later on, a scene structure followed, which allowed us to quickly change between different visualizations and tasks.
Another important step was implementing the tracking, which is essential to the whole idea of the project. Since directly streaming the data from our tracking system to the tablet quickly saturated the tablets network card, I developed a custom, UDP based server which strips all but the essential data from the tracking information and streams it to the tablet using binary serialization. This additional sever has an adjustable streaming rate as well as optional smoothing of the tracking data.
For the tracking itself, the users head position is transferred into the local coordinate system of the tablet for easier calculation of the camera parameters. Otherwise the tracking basically controls the position and orientation of the virtual camera and therefore enables changing the viewport by simply moving the tablet. It’s really a charm how easy the system works, but also how easy it for others to use it for exploring a 3D scene. Usually you only need to hand the tablet to someone without explaining anything and they immediately get it.
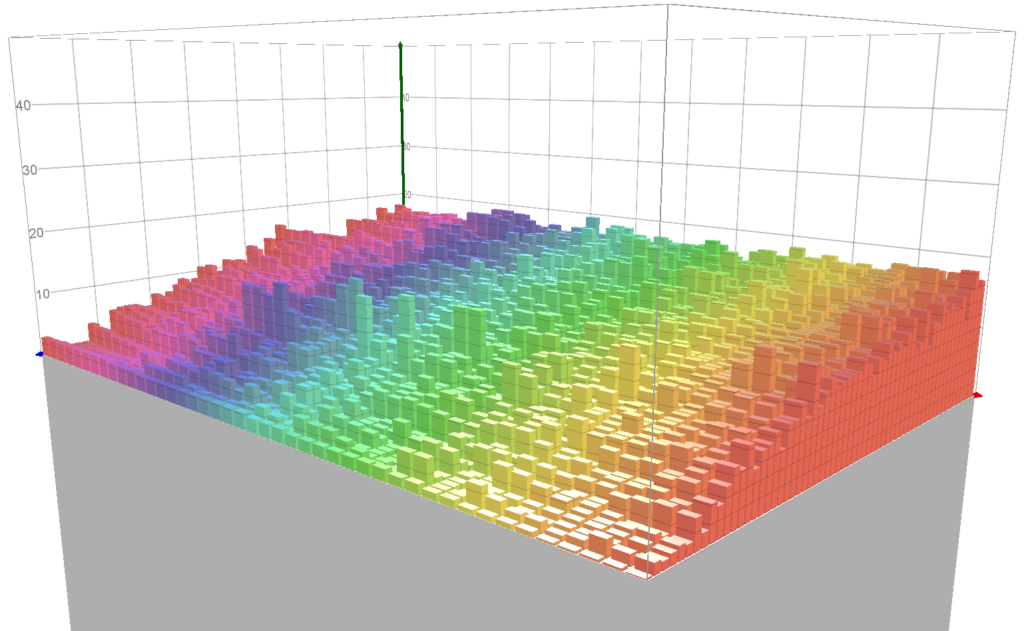
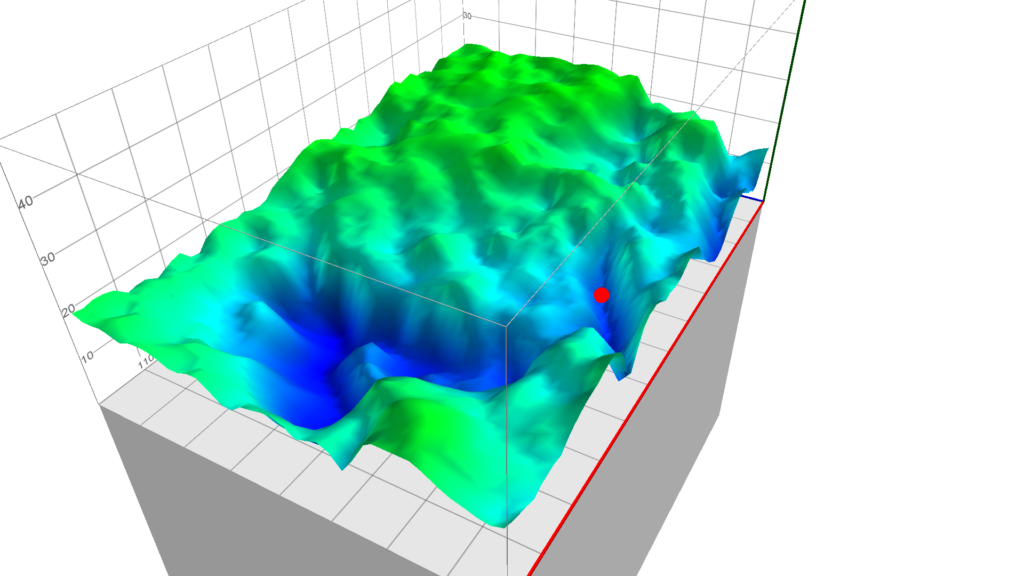
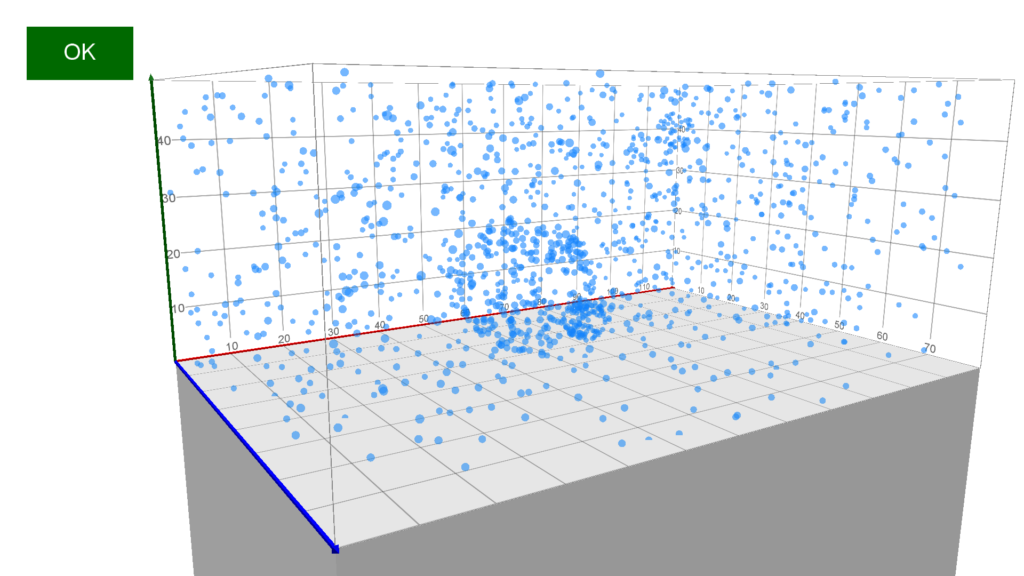
We build three visualizations for this prototype: A 3D bar chat and height map made by me and a 3D scatterplot by a colleague. As the naive approach of rendering every bar as a cube proved soon the be unfeasible for big charts as the number of draw calls rose, a lot of optimization took place. The obvious solution was putting all bars into a single large vertex buffer. However, we wanted to still be able to interact with bars, so they logically remain as separate entities so they can be, e.g., selected independently.
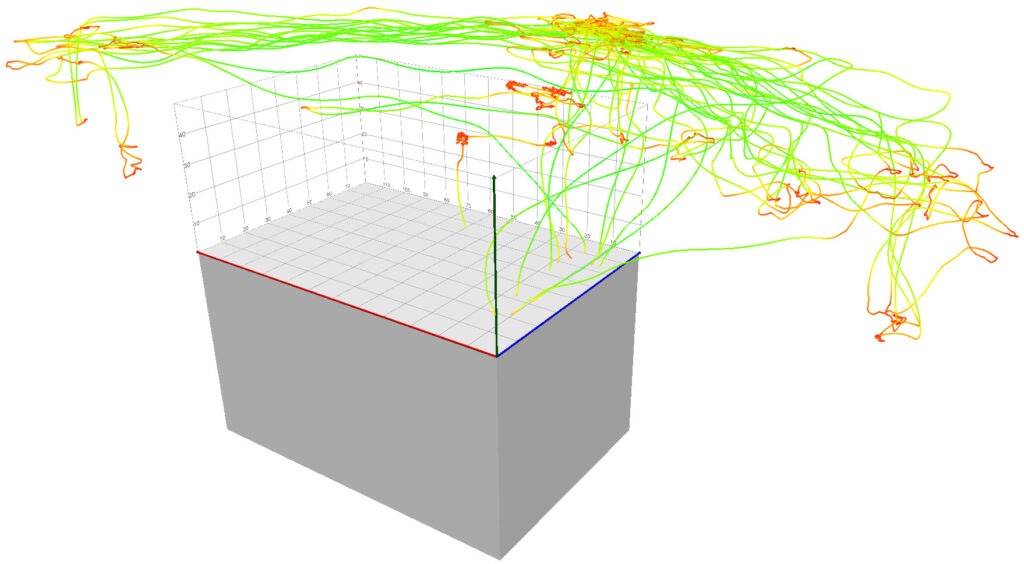
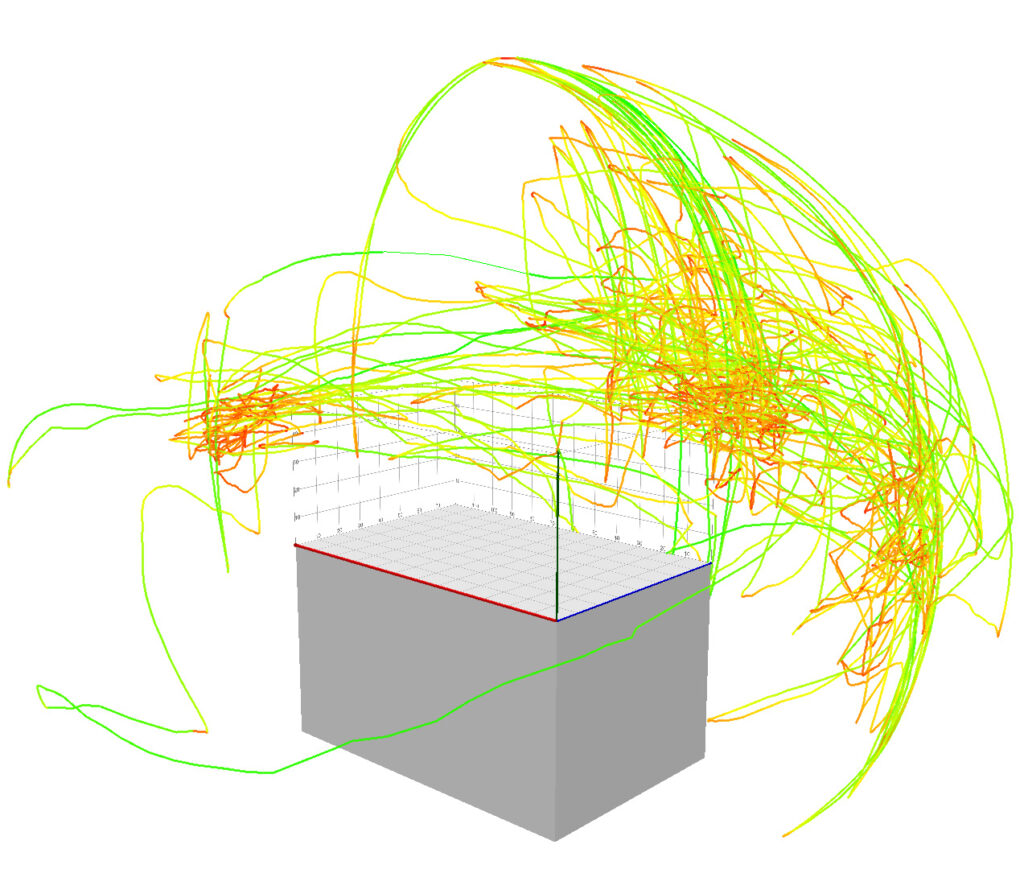
One of the things that we were interested with this research was how users moved around the room when using spatial interaction with the tablet. We wanted to compare this physical movement with the virtual camera movement when using touch interaction to manipulate the view. Therefore we recorded the position and orientation of the camera at periodic intervals. To analyze them, I wrote a visualization that plots them as line strips directly into the virtual scene that users were exploring. In the color encoded is the speed of the users, so that we could see where users remained mostly stationary. This enabled us to use the same prototype we conducted out study with to also analyze the results with, which was splendid.
