PARVis is a framework for extending 2D visualizations on large interactive displays with personal Augmented Reality overlays, to extend visualizations with additional data, address perception issues and guide users attention. User can interact with the 2D Visualizations using touch interaction on the display. We present several visualization techniques and demonstrate how they can enhance the experience for user when working with visualizations on large displays. PARVis was developed at the Interactive Media Lab Dresden and build upon the u2vis framework. It was published as a full paper at the IEEE Transactions on Visualization and Computer Graphics (TVCG) journal and presented at the VIS’20 conference.
Motivation
The emerging field of Immersive Analytics concerns itself with applying Augmented Reality (AR) and Virtual Reality (VR) to the domain of information visualization. Instead of just transferring conventional visualization techniques into AR, we wanted to explore how large, conventional screens can be extended with AR techniques instead. Conventional screens have several advantages over purely immersive views: They are physical objects that can be touched and interacted with directly. They can be seen by all persons in the room without requiring special hardware. They may also offer a better resolution than immersive displays, resulting in a higher level of detail that can be shows, which is of course important for visualizations. They have some disadvantages as well: Visualizations are confined to the 2D surface of the display. No personal or personalized information can be shown when multiple users work with the display at the same time. When working in front of a large display, it can be hard to perceive distant areas of the display without moving over or stepping back. We noticed that these disadvantages may be addressed using head-coupled Augmented Reality. Thus, PARVis was born.
Team
The prototype was mostly developed by myself. Another developer helped in the later stages of the prototype to implement some of the techniques under my supervision. The concepts of the presented techniques were developed in a team of three people.
Technology
PARVis was first developed using the Unity 3D engine and our own u2vis framework for the original HoloLens. Later on we transitioned to the HoloLens 2. For the interactive displays, we used a Microsoft Surface Hub 1 84″ display, and a display wall consisting of 12 55″ displays.
Development
The idea of using AR for extending visualizations on conventional displays floated around for several years before PARVis finally materialized. At the beginning the work was focused on the conceptional side, figuring out interesting aspects of augmenting visualizations and also identifying limitations of conventional 2D visualization that might by addressable with AR. At the same time, we were trying out existing visualizations frameworks for Unity that could serve as the foundation for our prototype.
Visualization Framework
Sadly, we found several limitations with every existing visualization framework we tried, that would make the implementation of our ideas challenging. Therefore we eventually decided to create our own. What was initially thought to be a foundation just for PARVis quickly got a life on its own. To offer the flexibility needed for our AR techniques it became apparent, that we would profit from having a modular, extensible visualization framework that could work both in AR and on the display. We also wanted to be able to incorporate a large variety of datasets, which made sophisticated data handling another requirement. Thus, the project developed more and more into a general visualization framework that could be used for a variety of applications, not only PARVis. The eventual result of this development is the u2vis framework.
Addressing Perception Issues
When working in front of a large display, it can be hard to make out other parts of the screen without stepping back. We wanted to address this issue with PARVis with two major techniques. The first one is the hinged visualizations technique. Visualizations on the screen are transferred into AR and placed orthogonal on the screen when a user is far away from them. Thus the user can read them from their current position without the visual distortion. When a user moves closer to a hinged visualization, it gradually moves back towards the screen like if attached to a hinge on the side of the visualization, hence the name of the technique. When a user is in front of the visualization, is has transitioned fully back to the display and no AR elements remain visible.
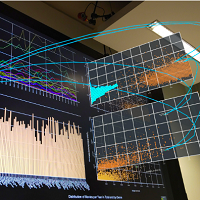
The second technique we developed curves the whole screen towards the user in a semi-circle. Thus all parts of the screen remain visible wherever a user is currently located. When they move in front of the screen, the curvature moves with them so that in front of them they can always see and interact with the real display, while the AR curves stretch to the left and right of them. Besides being a great technique for addressing perception issues, this technique is simply impressive to see and try out in real when using the prototype.
Personal Views
One of the main disadvantages when working on a large display with multiple people is that everything is always visible to everybody. This means that displaying private or personalized information is difficult. It also means that the interactions of one user may obstruct the work of another one. We found that this can be addressed with employing AR as well. For example, we demonstrated an annotation technique, where a user can write annotations directly onto the screen using a digital pen. Except that the annotations are not rendered on the screen, but in AR instead. That means they are only visible to the user who created them. Furthermore, we also developed AR Brushing an linking techniques by superimposing 3D splines on the display to highlight connections. Not only does this guide the attention of the user to other parts of the display, but it also enables personal brushing and linking for every user. Thus, selections from one user don’t obstruct other users and each can have their own selections independently from each other.
Showing Additional Information
PARVis shows multiple connected visualizations on a large display. While this enables to show a vast amount of data as the same time, even that might not be sufficient to visualize large, multivariate data sets. Furthermore, it requires users to frequently switch context and search for other relevant visualizations on the display. To address this, we experimented with superimposing additional data directly on the display in AR. For example, our layered visualizations show additional visualizations on front and behind of the display that can be swapped through using touch interaction on the display. Furthermore, embedded visualizations can show additional information for a particular data item when it is selected, embedding them orthogonal to the display directly at the position of the data item.
Verdict
PARVis was an interesting challenge in finding another approach of applying immersive technologies to information visualizations. I think the techniques we developed showcase that there can be a real benefit of this combination for analysts when performing visual analysis on large screens. Besides that, PARVis was also a technical challenge and gave opportunity for the development of many concepts, first and foremost our Unity visualization framework u2vis. Adapting the experience we gained when developing DesignAR to large screens was also challenging, because alignment issues become much more severe when the screen is several meters long (especially regarding rotation). All in all, I’m satisfied with the way PARVis turned out and we also got a nice publication out of it.